编程|遥感影像显示拉伸
编程|遥感影像显示拉伸
ytkz计算机显示图像主要以两种方式的数据类型:浮点型和整型。
浮点型:图像范围大小在0:1之间
整型:图像范围大小在0:255之间
其中,0:255的整型也称为8bit,8字节。一个字节代表01,8个字节也就是2的8次方,等于255。正常图像通常是8bit,即可直接在手机端或者PC端直接显示。
若R、G、B每种颜色使用一个字节(8bit)表示,每幅图像可以有1670万种颜色;
若R、G、B每种颜色使用两个字节(16bit)表示,每幅图像可以有10的12次方种颜色;
如果是灰度图像,每个象素用一个字节(8bit)表示,一幅图像可以有256级灰度;
若每个象素用两个字节(16bit)表示,一幅图像可以有65536级灰度。
理论上说,16bit的图像,灰度级数和颜色比8bit的好得多,但是,还得看你的印刷硬
件是否支持那么多灰度级数和颜色的印刷。如果在普通显示器上观看,两者并没有什么差别。
色彩深度(Depth of Color),色彩深度又叫色彩位数。视频画面中红、绿、蓝三个颜色
通道中每种颜色为N位,总的色彩位数则为3N,色彩深度也就是视频设备所能辨析的色彩
范围。目前有18bit、24bit、30bit、36bit、42bit和48bit位等多种。24位色被称为真彩
色,R、G、B各8bit,常说的8bit,色彩总数为1670万,如诺基亚手机参数,多少万色素
就这个概念。
而遥感影像一般是12bit或者16bit。以landsat9影像为例,它可以有65536级灰度,属于
16bit数据,但是显示的时候需要做一个映射过程:16bit->8bit,把原始的数据压缩映射到
0-255或者0-1,这个过程在遥感领域称为拉伸,在过程使用的方法称为拉伸方式。使用直
方图的形式可以形象地描绘出原始影像到显示影像的过程细节。
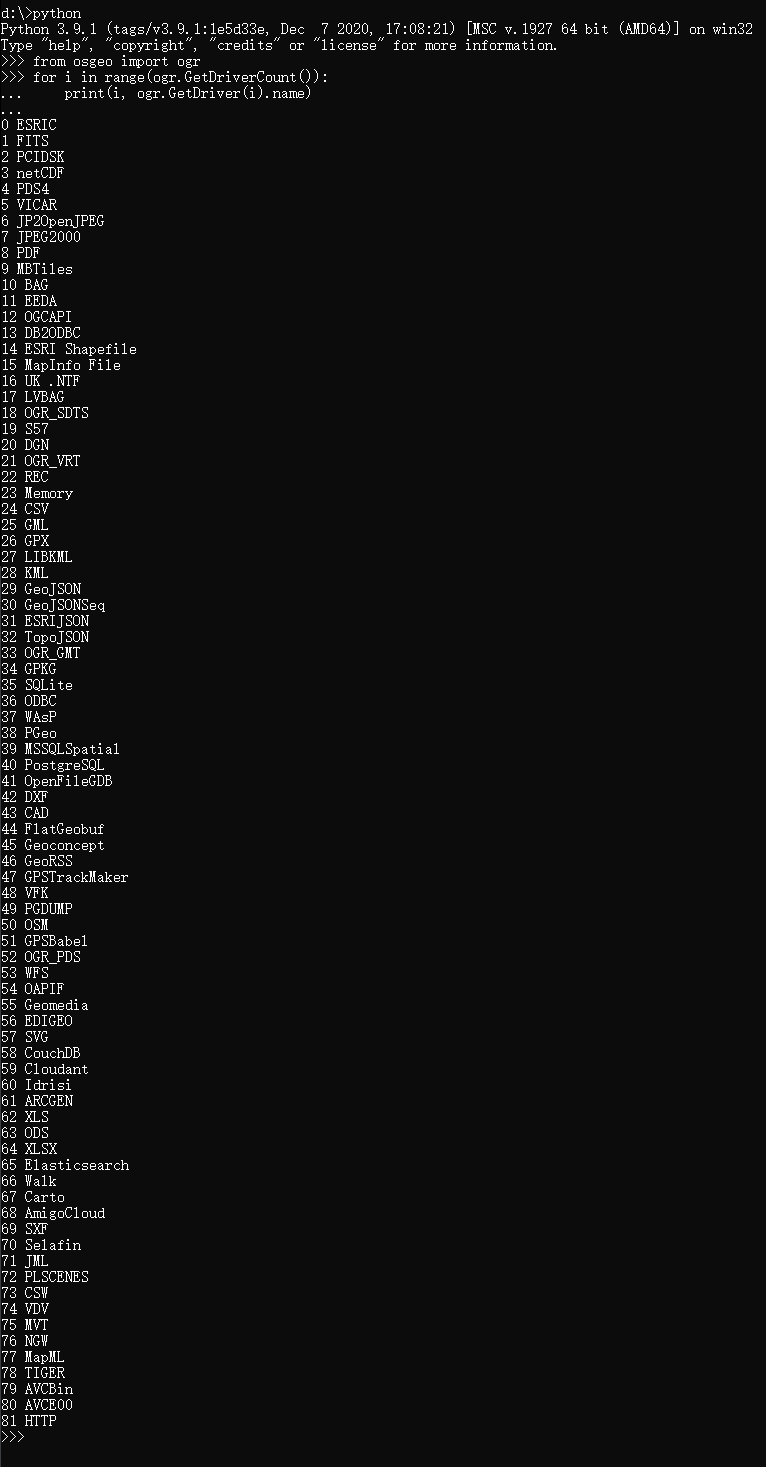
解压后的LANDSAT9文件夹
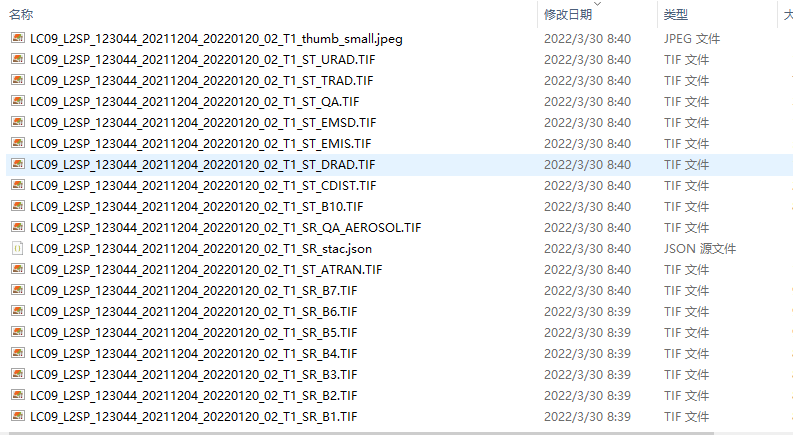
原始影像直接可视化:

# 提示警告
Clipping input data to the valid range for imshow with RGB data ([0..1] for floats or [0..255] for integers).
其直方图如下:

显示为全白的原因在于其数据大小,大于255。即全转为了255(白色为255)
为了其能正常显示,我们选择第一种拉伸方式(最大值拉伸),字面意思就是每个像素值
除以这景影像的最大值,保证其能缩放在0-1范围。

直方图如下:

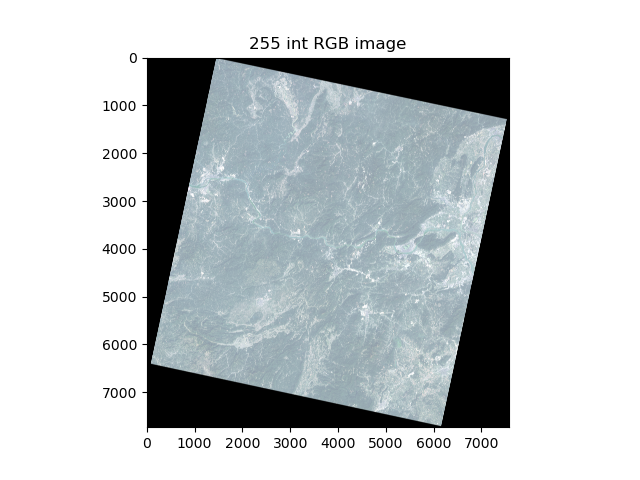
现在是以浮点型显示,接下来可以转为整型,再次观察有无变化。
具体操作是,在上图的基础上,使用1%线性拉伸。
影像就是一个矩阵,用img表示。1%线性拉伸解释如下,

data_min 是待拉伸的矩阵的最小1%的数据
data_max 是待拉伸的矩阵的最大99%的数据
maxout = 255
minout = 0
result是拉伸后矩阵

result= minout + (img-data_min )/(data_max -data_min )*(maxout- minout)
拓展:2%线性拉伸或者x%线性拉伸,如上面的公式一般,修改data_min和data_max即可,如果无需转255,上式变为
result= (img-data_min )/(data_max -data_min )

或者是,直接对原始影像进行线性拉伸拉伸
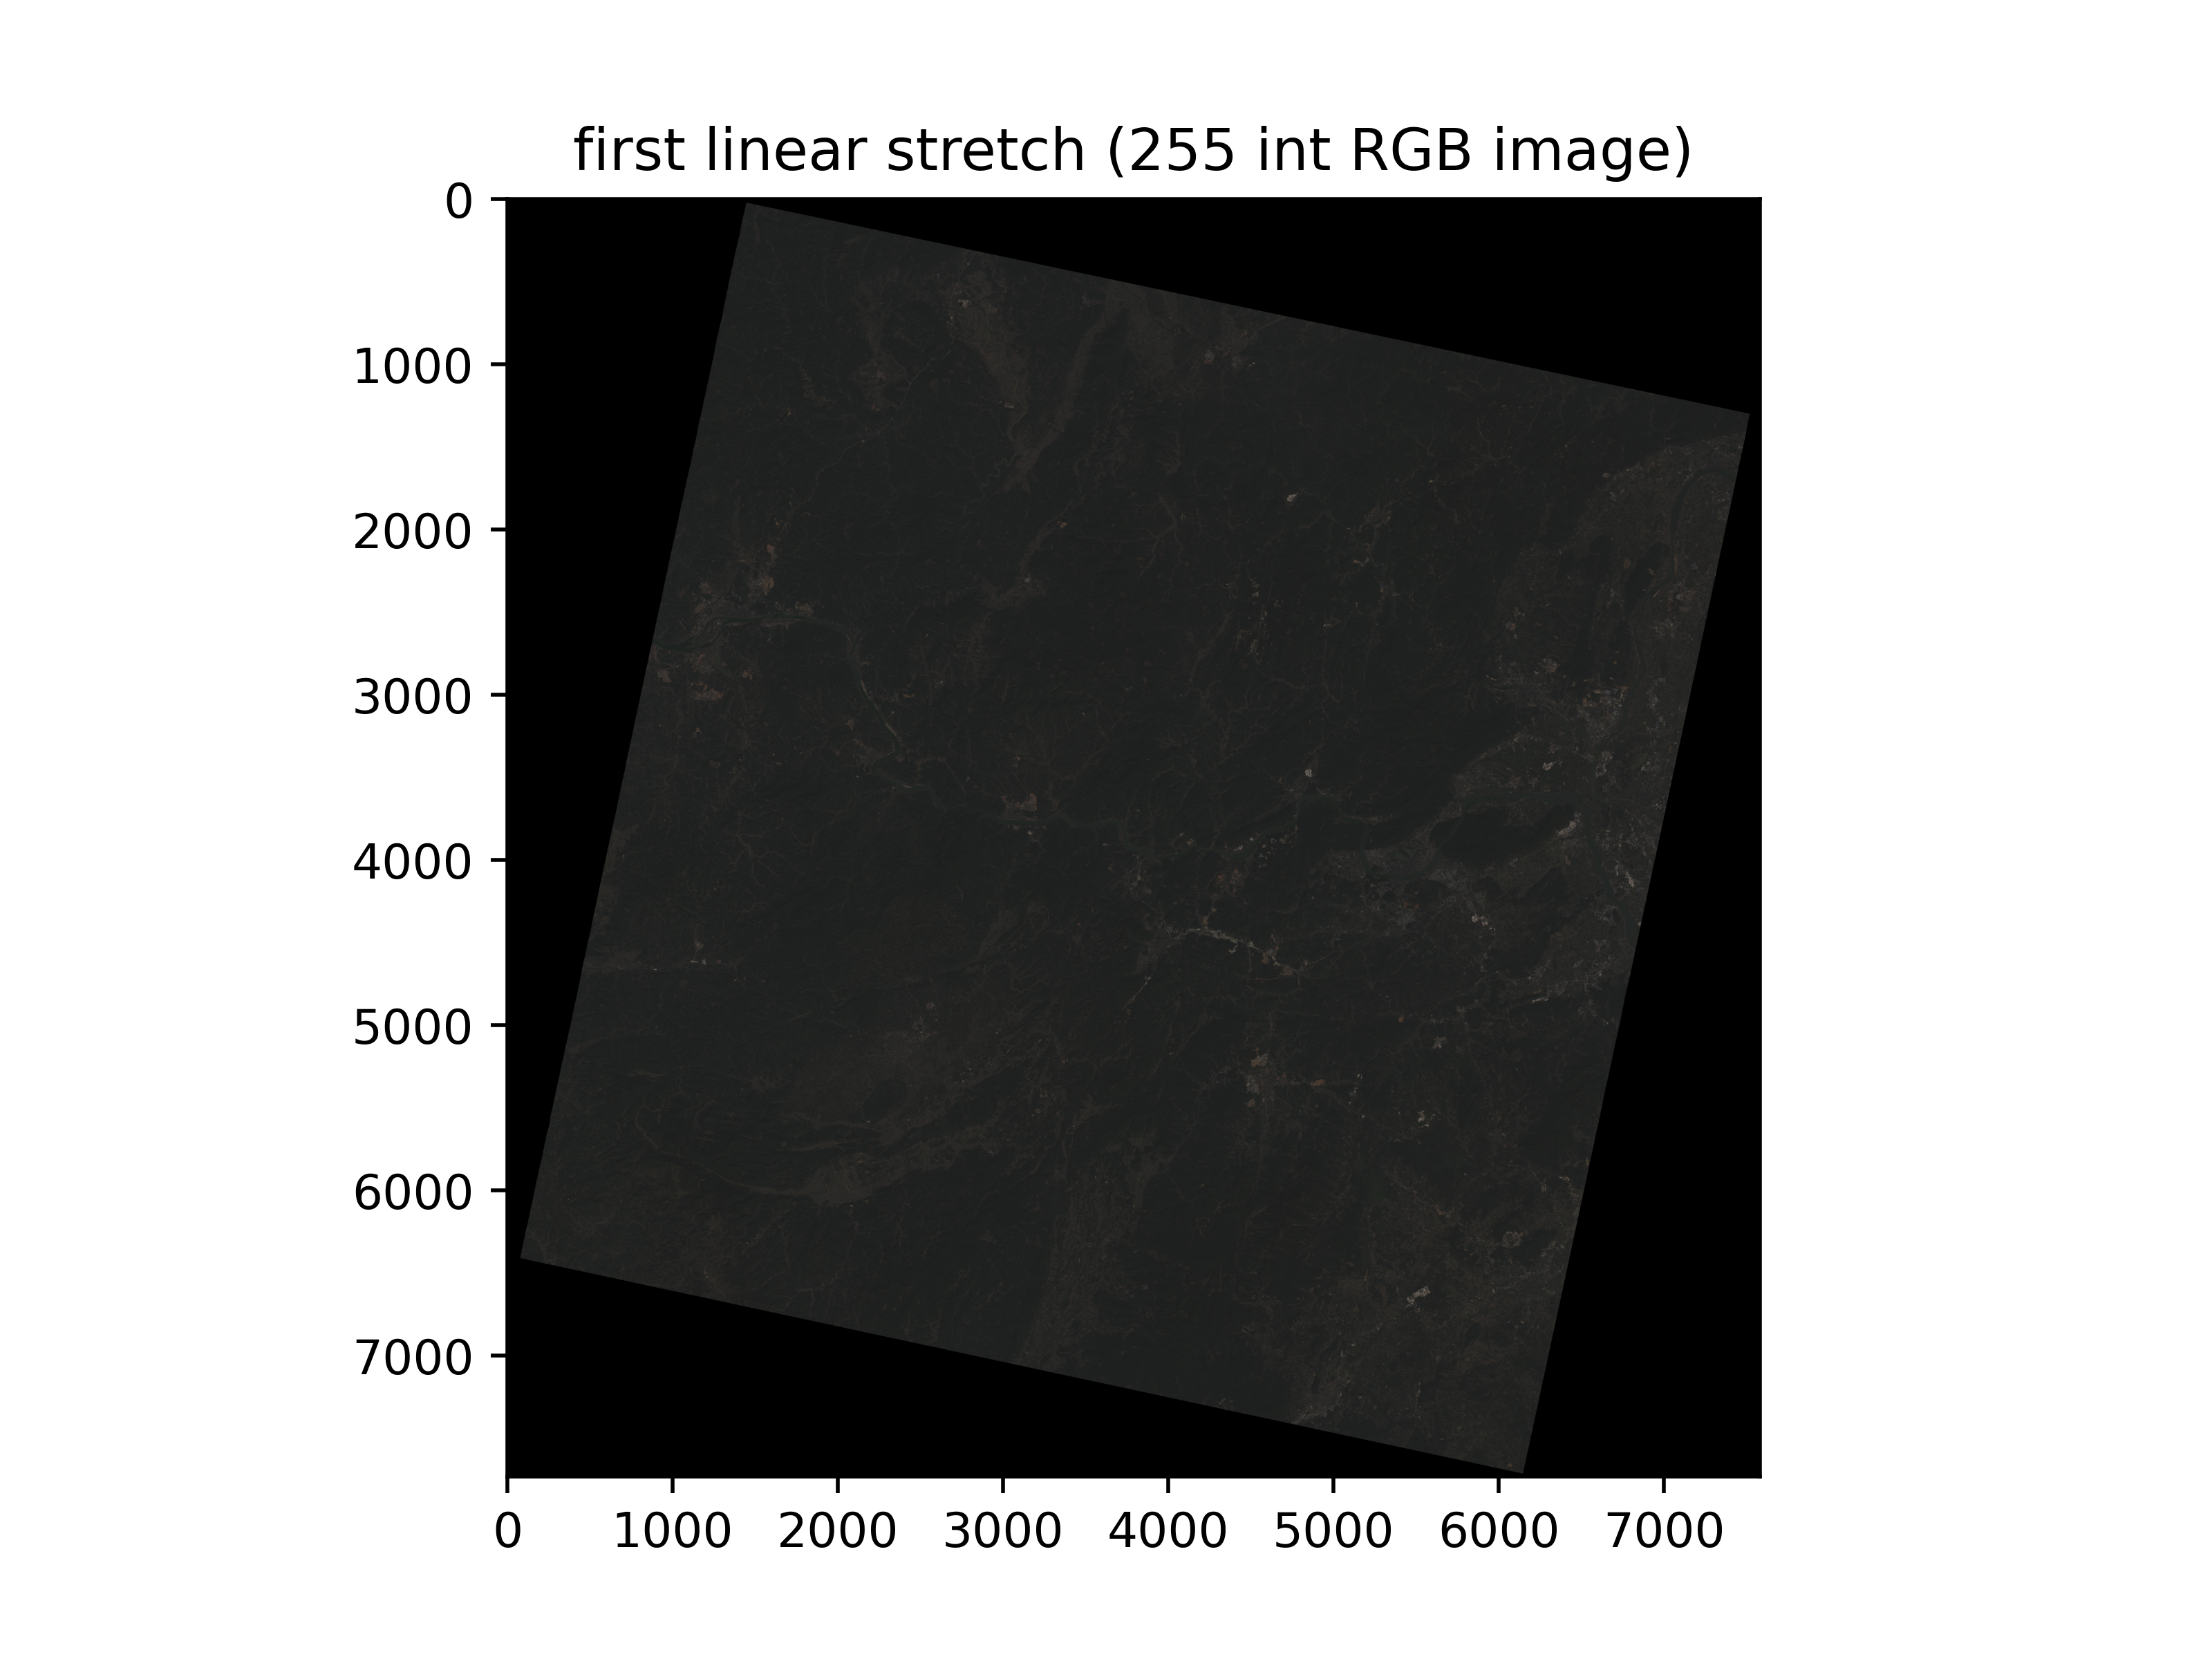
直方图如下:

本文代码(写的不规整,仅供参考)
#!/usr/bin/env python
# -*- coding: utf-8 -*-
# @Time : 2022/10/31 15:25
# @File : histogram.py
import numpy as np
from skimage import io, exposure
from matplotlib import pyplot as plt
import os
from osgeo import gdal
def color_image_show(img, title):
    """
    Show image
    Input:
    img - 3D array of uint16 type
    title - string
    """
    fig = plt.figure(figsize=(10, 10))
    fig.set_facecolor('white')
    plt.imshow(img/np.max(img))
    plt.title(title)
    # save
    go = True
    i = 1
    while  go:
        if os.path.exists('test' + str(i) +'.png') ==0:
            go = False
            name ='test' + str(i) +'.png'
            plt.savefig(name,dpi=500)
            plt.show()
        else:
            i += 1
    return img/np.max(img)

def determinate_band(path):
    tif_list = get_file_name(path, 'TIF')
    try:
        for tif in tif_list:
            if os.path.splitext(tif)[0].split('_')[-1] == 'B2':
                b = tif
            if os.path.splitext(tif)[0].split('_')[-1] == 'B3':
                g = tif
            if os.path.splitext(tif)[0].split('_')[-1] == 'B4':
                r = tif
            if os.path.splitext(tif)[0].split('_')[-1] == 'B5':
                nir = tif
            if os.path.splitext(tif)[0].split('_')[-1] == 'B6':
                swir1 = tif
            if os.path.splitext(tif)[0].split('_')[-1] == 'B7':
                swir2 = tif

    except:
        print('error')
    if b:
        return [b, g, r, nir, swir1, swir2]
def linear_stretch(data, num=1):
    x, y = np.shape(data)
    data_new = np.zeros(shape=(x, y))

    data_8bit = data
    data_8bit[data_8bit == -9999] = 0

    # 把数据中的nan转为某个具体数值,例如
    # data_8bit[np.isnan(data_8bit)] = 0
    d2 = np.percentile(data_8bit, num)
    u98 = np.percentile(data_8bit, 100 - num)

    maxout = 255
    minout = 0
    data_8bit_new = minout + ((data_8bit - d2) / (u98 - d2)) * (maxout - minout)
    data_8bit_new[data_8bit_new < minout] = minout
    data_8bit_new[data_8bit_new > maxout] = maxout
    data_8bit_new = data_8bit_new.astype(np.int32)

    return data_8bit_new
def get_file_name(file_dir, type):
    """
    搜索 后缀名为type的文件  不包括子目录的文件
    #
    """
    corretion_file = []
    filelist = os.listdir(file_dir)
    for file in filelist:
        if os.path.splitext(file)[1] == type:
            corretion_file.append(os.path.join(file_dir, file))
    if corretion_file == []:
        for file in filelist:
            if os.path.splitext(file)[1] == '.' + type:
                corretion_file.append(os.path.join(file_dir, file))
    return corretion_file

def main():
    path = r'X:\'  # 输入,Landsat 9 影像解压后的路径,你们要修改这里
    tif_list = determinate_band(path)

    # 影像的属性    # attribute
    g_set = gdal.Open(tif_list[1])
    transform = g_set.GetGeoTransform()
    driver = g_set.GetDriver()
    geoTransform = g_set.GetGeoTransform()
    ListgeoTransform = list(geoTransform)
    ListgeoTransform[5] = -ListgeoTransform[5]
    newgeoTransform = tuple(ListgeoTransform)
    proj = g_set.GetProjection()
    cols = g_set.RasterXSize
    rows = g_set.RasterYSize
    temp_arr = np.zeros((rows, cols, 6))
    ##  open tif
    for i in range(6):
        b_set = gdal.Open(tif_list[i])
        # b_set.SetNoDataValue(-9999)
        b = b_set.GetRasterBand(1).ReadAsArray()
        # b = linear_stretch_1(b)
        temp_arr[:, :, i] = b

    img432 = np.dstack((temp_arr[:,:,2], temp_arr[:,:,1], temp_arr[:,:,0]))

    plt.imshow(img432)
    plt.savefig('originRGB.png', dpi=500)
    fig = plt.figure(figsize=(10, 7))
    fig.set_facecolor('white')

    for color, channel in zip('rgb', np.rollaxis(img432, axis=-1)):
        counts, centers = exposure.histogram(channel)
        plt.plot(centers[1::], counts[1::], color=color)
    plt.title('origin RGB histogram')
    plt.savefig('originHistogram.png',dpi=500)
    plt.show()
    # 覆盖原先的img432
    stretchimg432 = color_image_show(img432, 'Landsat 9')
    for color, channel in zip('rgb', np.rollaxis(stretchimg432, axis=-1)):
        counts, centers = exposure.histogram(channel)
        plt.plot(centers[1::], counts[1::], color=color)
    plt.title('max stretch histogram')
    plt.savefig('stretchHistogram.png',dpi=500)
    plt.show()
    plt.imshow(stretchimg432)
    plt.savefig('maxRGB.png', dpi=500)
    fig = plt.figure(figsize=(10, 7))
    fig.set_facecolor('white')

    to255RGB = stretchimg432
    for i in range(3):
        to255RGB[:,:,i] = linear_stretch(stretchimg432[:,:,i],1)
    to255RGB = to255RGB.astype(np.int32)
    to255RGB = np.where(to255RGB>254,255,to255RGB)
    plt.imshow(to255RGB)
    plt.title('255 int RGB image')
    plt.savefig('RGB255.png',dpi=100)
    plt.show()

    for color, channel in zip('rgb', np.rollaxis(to255RGB, axis=-1)):
        counts, centers = exposure.histogram(channel)
        plt.plot(centers[1::], counts[1::], color=color)
    plt.title('first max stretch then linear stretch (255 int RGB image)')
    plt.savefig('linear1%.png',dpi=500)
    plt.show()


    to255RGB = stretchimg432
    for i in range(3):
        to255RGB[:,:,i] = linear_stretch(img432[:,:,i],0)
    to255RGB = to255RGB.astype(np.int32)
    plt.imshow(to255RGB)
    plt.title('first linear stretch (255 int RGB image)')
    plt.savefig('immediatelyRGB255.png',dpi=500)
    plt.show()

    for color, channel in zip('rgb', np.rollaxis(to255RGB, axis=-1)):
        counts, centers = exposure.histogram(channel)
        plt.plot(centers[1::], counts[1::], color=color)
    plt.title('immediately 1 % stretch histogram')
    plt.savefig('firstlinear1%.png',dpi=500)
    plt.show()

    to255RGB = np.where(to255RGB<120,120,to255RGB)
if __name__ == "__main__":
    main()
小结
拉伸方式有很多种,这里不做一一介绍,共同点就是按照某个数学公式把不同数据范围转化为0-1或者0-255。