匀色 | 直方图匹配算法及其代码
匀色 | 直方图匹配算法及其代码
ytkz相关理论不再展示,感兴趣去网上搜,现在是基于图片图片进行匀色,代码如下:
# -*- coding: utf-8 -*-
# @Time : 2022/01/05 10:18
import numpy as np
from matplotlib import pyplot as plt
import cv2
import matplotlib
import time
# 进行直方图匹配的函数
def arrayToHist(grayArray,nums):
if(len(grayArray.shape) != 2):
print("length error")
return None
w,h = grayArray.shape
hist = {}
for k in range(nums):
hist[k] = 0
for i in range(w):
for j in range(h):
if(hist.get(grayArray[i][j]) is None):
hist[grayArray[i][j]] = 0
hist[grayArray[i][j]] += 1
#normalize
n = w*h
for key in hist.keys():
hist[key] = float(hist[key])/n
return hist
def histMatch(grayArray1,h_d):
#计算累计直方图
tmp = 0.0
h_acc = h_d.copy()
for i in range(256):
tmp += h_d[i]
h_acc[i] = tmp
h1 = arrayToHist(grayArray1,256)
tmp = 0.0
h1_acc = h1.copy()
for i in range(256):
tmp += h1[i]
h1_acc[i] = tmp
#计算映射
M = np.zeros(256)
for i in range(256):
idx = 0
minv = 1
for j in h_acc:
if (np.fabs(h_acc[j] - h1_acc[i]) < minv):
minv = np.fabs(h_acc[j] - h1_acc[i])
idx = int(j)
M[i] = idx
des = M[grayArray1]
return des
#计算累计直方图计算出新的均衡化的图片,nums为灰度数,256
def equalization(grayArray,h_s,nums):
#计算累计直方图
tmp = 0.0
h_acc = h_s.copy()
for i in range(256):
tmp += h_s[i]
h_acc[i] = tmp
if(len(grayArray.shape) != 2):
print("length error")
return None
w,h = grayArray.shape
des = np.zeros((w,h),dtype = np.uint8)
for i in range(w):
for j in range(h):
des[i][j] = int((nums - 1)* h_acc[grayArray[i][j] ] +0.5)
return des
#传入的直方图要求是个字典,每个灰度对应着概率
def drawHist(hist,name):
keys = hist.keys()
values = hist.values()
x_size = len(hist)-1#x轴长度,也就是灰度级别
axis_params = []
axis_params.append(0)
axis_params.append(x_size)
#plt.figure()
if name != None:
plt.title(name)
plt.bar(tuple(keys),tuple(values))#绘制直方图
#plt.show()
def multi_channel_hist_match(origin_arr,match_arr):
"""
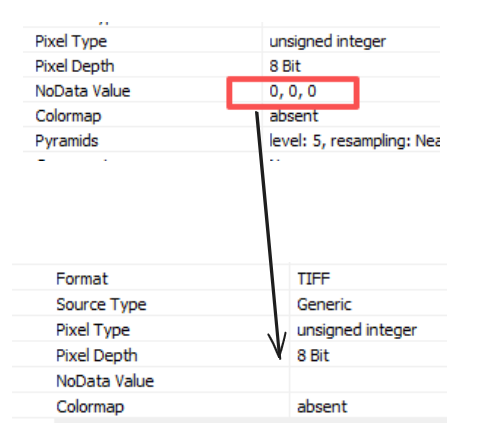
:param origin_arr: 待匹配的图像,要求8bit
:param match_arr: 匹配的主图像,要求8bit
:return: 直方图匹配后的图像
"""
if len(np.shape(origin_arr))==3:
x, y, z = np.shape(origin_arr)
print(np.shape(origin_arr))
img = np.zeros(shape=(x, y, z)).astype(int)
for i in range(z):
print(i+1)
hist_s = arrayToHist(origin_arr[:,:,i], 256)
# drawHist(hist_s,"原始直方图")
hist_m = arrayToHist(match_arr[:,:,i], 256)
im_d = histMatch(origin_arr[:,:,i], hist_m)
# hist_d = arrayToHist(im_d, 256)
# im_d = ((im_d ) / (np.nanmax(im_d)) * 255).astype(int)
im_d = ((im_d - np.nanmin(im_d)) / (np.nanmax(im_d) - np.nanmin(im_d)) * 255).astype(int)
img[:, :, i] = im_d
elif len(np.shape(origin_arr)) == 2:
x, y = np.shape(origin_arr)
print(np.shape(origin_arr))
img = np.zeros(shape=(x, y)).astype(int)
hist_s = arrayToHist(origin_arr, 256)
# drawHist(hist_s,"原始直方图")
hist_m = arrayToHist(match_arr, 256)
im_d = histMatch(origin_arr, hist_m)
# hist_d = arrayToHist(im_d, 256)
im_d = ((im_d - np.nanmin(im_d)) / (np.nanmax(im_d) - np.nanmin(im_d)) * 255).astype(int)
img = im_d
else:
raise Exception
print('完成直方图匹配')
return img
if __name__ == '__main__':
a = time.time()
matplotlib.rcParams['font.sans-serif']=['SimHei'] # 用黑体显示中文
imdir = "Colorbalance_1.jpg"#原始图片的路径
imdir_match = "Colorbalance_2.jpg"
#直方图匹配
#打开文件并灰度化
im_s = cv2.imread(imdir)
im_s = im_s[..., ::-1]
#打开文件并灰度化
im_match = cv2.imread(imdir_match)
im_match = im_match[..., ::-1]
img = multi_channel_hist_match(im_match,im_s)
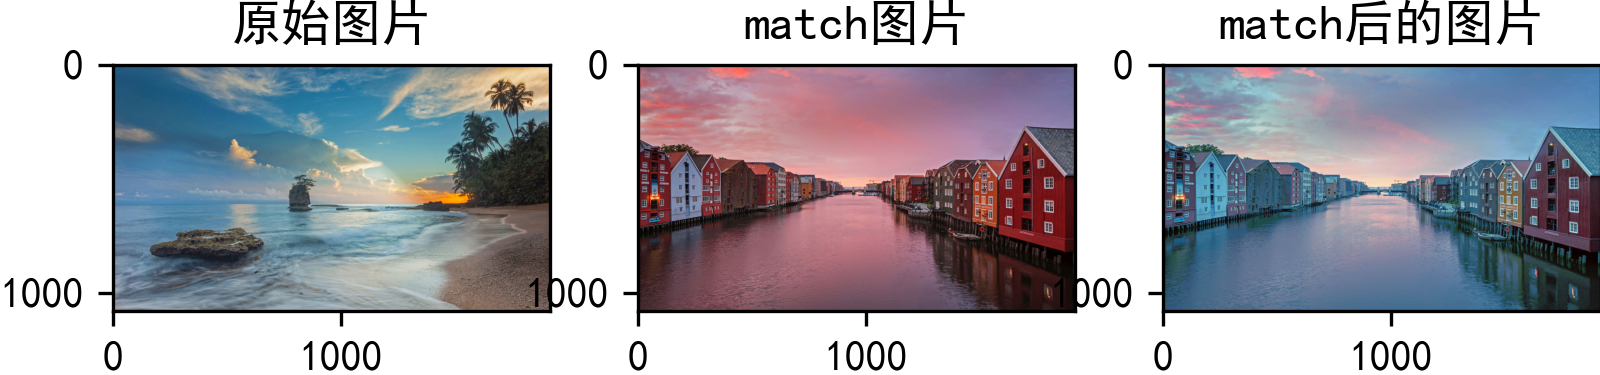
plt.figure()
plt.subplot(1, 3, 1)
plt.title("原始图片")
plt.imshow(im_s)
plt.subplot(1, 3, 2)
plt.title("match图片")
plt.imshow(im_match)
plt.subplot(1, 3, 3)
plt.title("match后的图片")
plt.imshow(img)
plt.savefig(r'1.png'
, format='png'
, bbox_inches='tight'
, pad_inches=0
, dpi=300)
plt.show()
b = time.time()
print('耗时 %d秒'%(b-a))
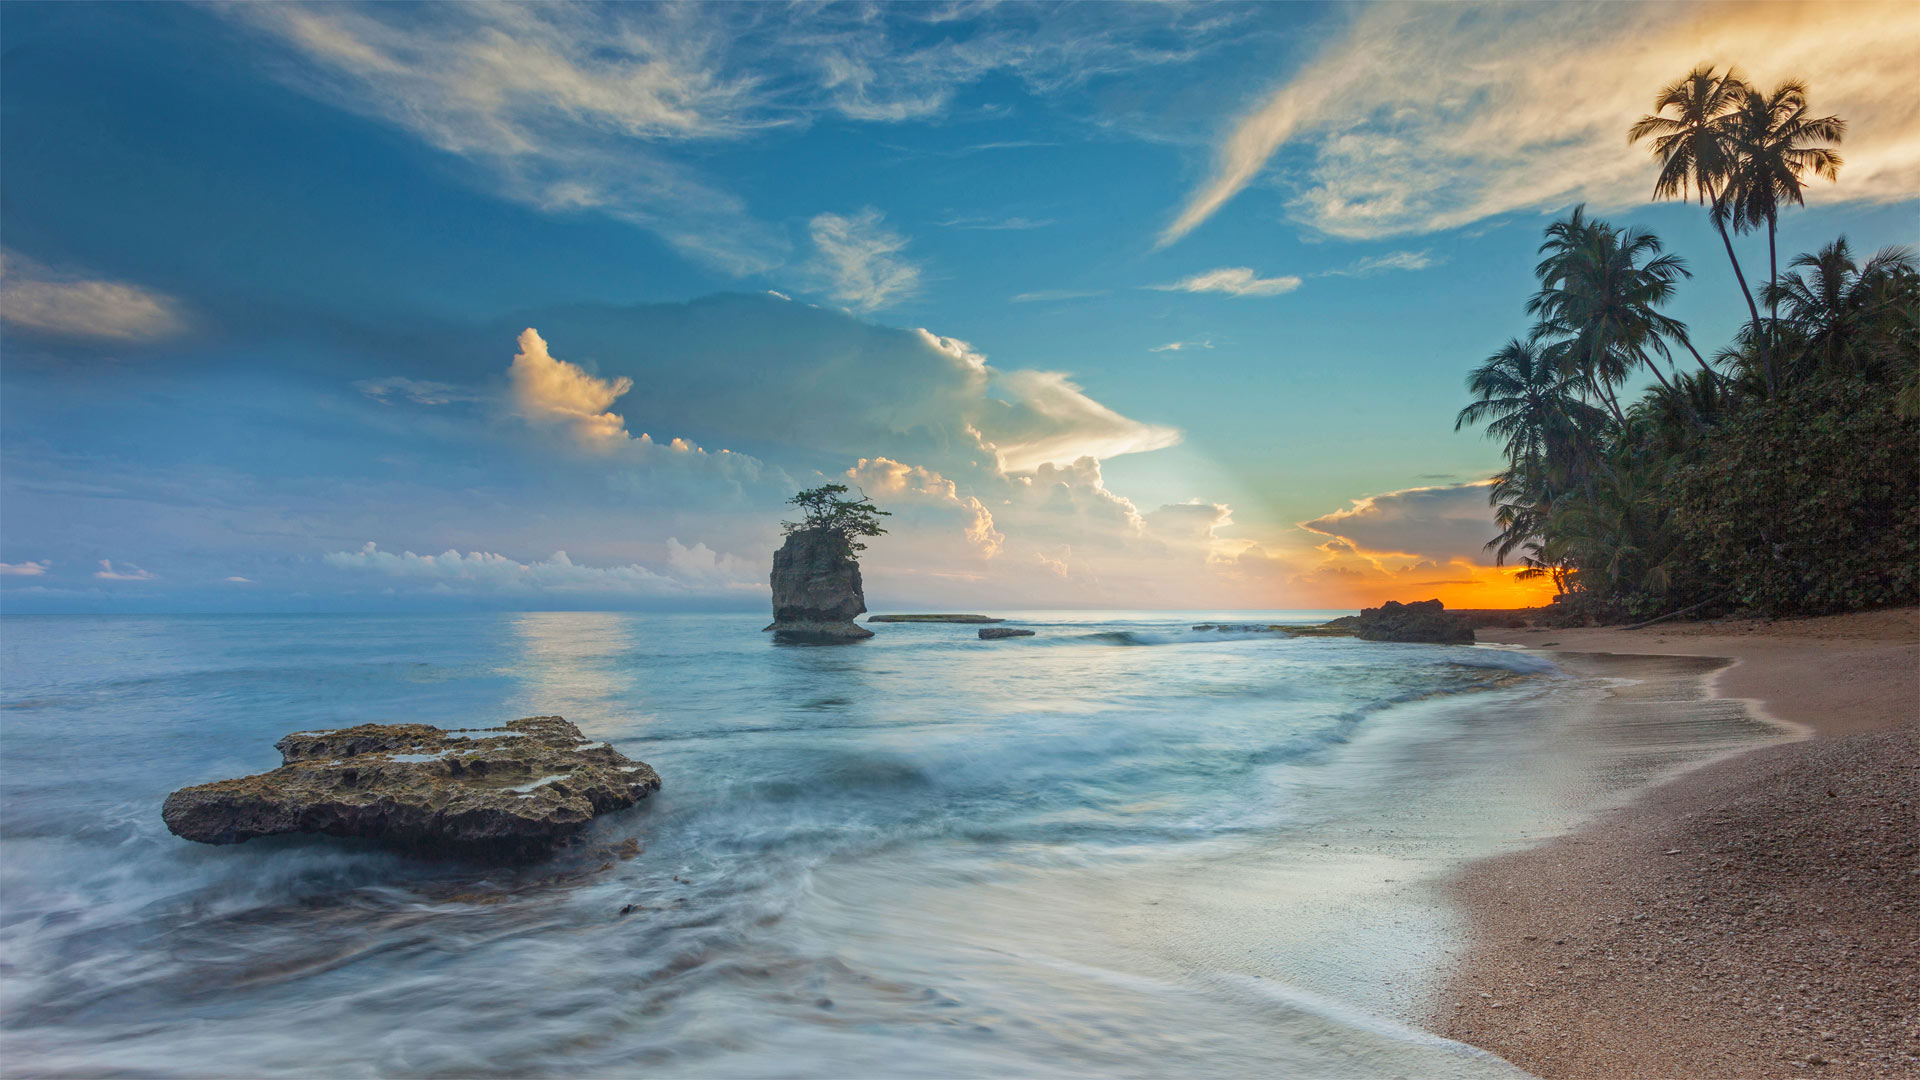
测试1
测试2

小结
注意的是两张影像的尺度保持一致,二者均为(1080,1920,3)。