学习Rasterio还是GDAL?
学习Rasterio还是GDAL?
ytkzrasterio是什么?
GDAL (Geospatial Data Abstraction Library) 是地理空间数据处理领域的基石。它是一个用 C++ 编写的开源库
然而,GDAL 的强大也带来了它的“缺点”。它的官方 Python 绑定 (osgeo.gdal) 是从 C++ 代码自动生成的,这导致了它的 API 对于 Python 开发者来说不够友好。
Rasterio 的诞生就是为了解决 GDAL Python 绑定的这些痛点。它把自己定位为“GDAL for Python users”,它不是要取代 GDAL,而是架设在 GDAL 强大的能力之上,提供了一个更加现代、简洁和“Pythonic”的接口。
重要的一点是:Rasterio并没有重新发明轮子,它的核心功能依然依赖于GDAL。
我以前是通过学习rasterio的源代码,进而学习行业内的高手是怎么封装GDAL完成不同的功能。
这个过程的步骤是:
1.安装pycharm
2.安装rasterio
3.打开在pycharm打开某个rasterio的代码。
比如下面的是rasterio封装了matplotlib、numpy、gdal的部分代码,实现了遥感图像的可视化。
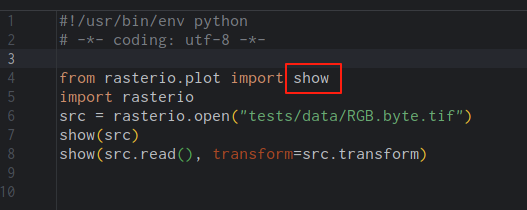
代码如下:
from rasterio.plot import show
import rasterio
src = rasterio.open("tests/data/RGB.byte.tif")
show(src)
show(src.read(), transform=src.transform)
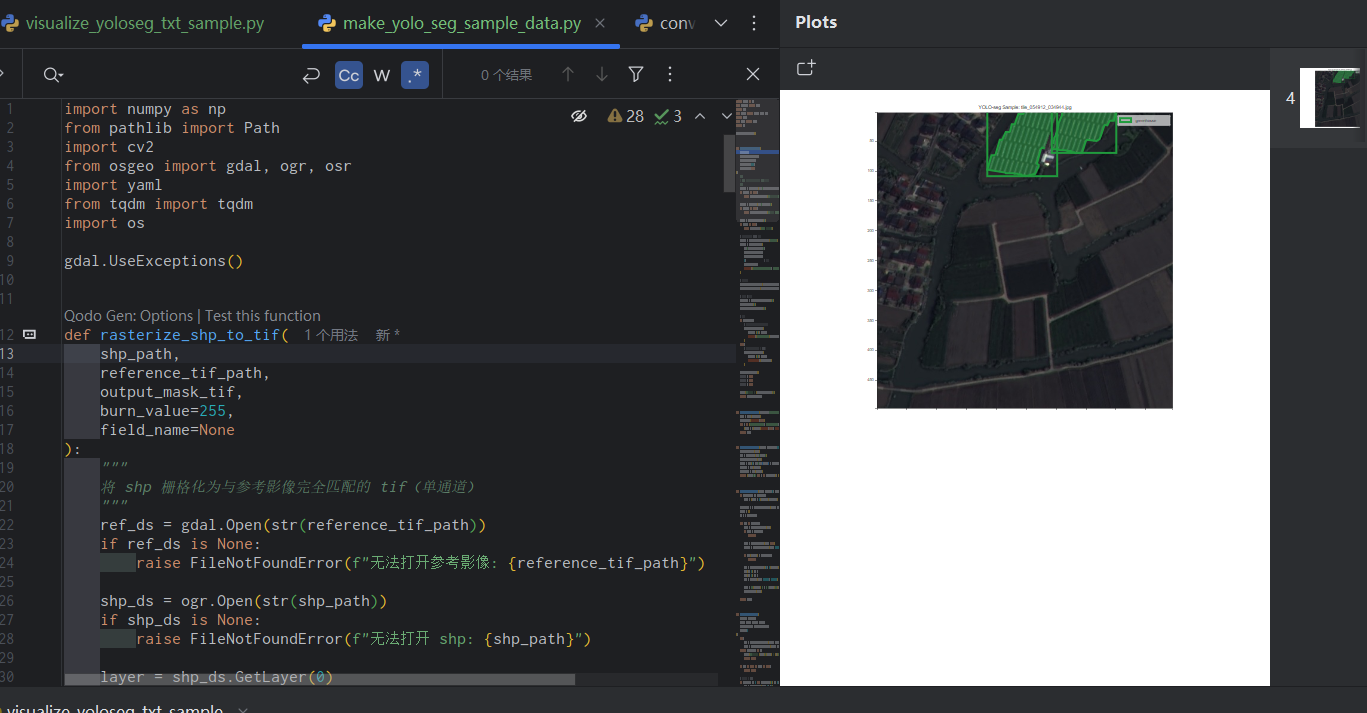
可视化结果如下:
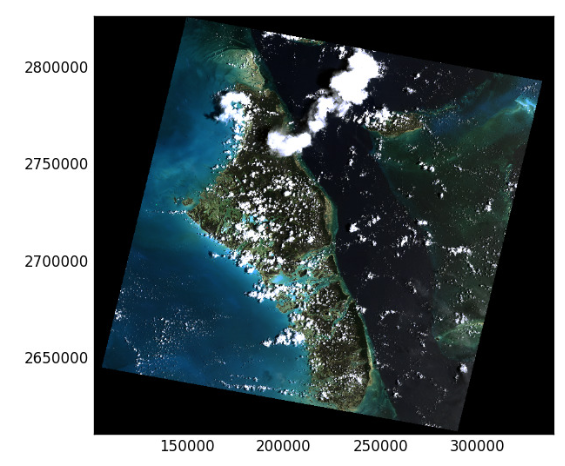
我们要学这个过程是怎么实现的,只需要这样操作:按住ctrl键,鼠标点击show,如下图所示。这样就可以跳转到rasterio关于show函数的源代码。
下面的就是关于show函数的源代码:
def show(source, with_bounds=True, contour=False, contour_label_kws=None,
         ax=None, title=None, transform=None, adjust=False, **kwargs):
    """Display a raster or raster band using matplotlib.

    Parameters
    ----------
    source : array or dataset object opened in 'r' mode or Band or tuple(dataset, bidx)
        If Band or tuple (dataset, bidx), display the selected band.
        If raster dataset display the rgb image
        as defined in the colorinterp metadata, or default to first band.
    with_bounds : bool (opt)
        Whether to change the image extent to the spatial bounds of the image,
        rather than pixel coordinates. Only works when source is
        (raster dataset, bidx) or raster dataset.
    contour : bool (opt)
        Whether to plot the raster data as contours
    contour_label_kws : dictionary (opt)
        Keyword arguments for labeling the contours,
        empty dictionary for no labels.
    ax : matplotlib axes (opt)
        Axes to plot on, otherwise uses current axes.
    title : str, optional
        Title for the figure.
    transform : Affine, optional
        Defines the affine transform if source is an array
    adjust : bool
        If the plotted data is an RGB image, adjust the values of
        each band so that they fall between 0 and 1 before plotting. If
        True, values will be adjusted by the min / max of each band. If
        False, no adjustment will be applied.
    **kwargs : key, value pairings optional
        These will be passed to the matplotlib imshow or contour method
        depending on contour argument.
        See full lists at:
        https://matplotlib.org/stable/api/_as_gen/matplotlib.pyplot.imshow.html
        or
        https://matplotlib.org/stable/api/_as_gen/matplotlib.pyplot.contour.html

    Returns
    -------
    ax : matplotlib Axes
        Axes with plot.
    """
    plt = get_plt()

    if isinstance(source, tuple):
        arr = source[0].read(source[1])
        if len(arr.shape) >= 3:
            arr = reshape_as_image(arr)
        if with_bounds:
            kwargs['extent'] = plotting_extent(source[0])
    elif isinstance(source, DatasetReader):
        if with_bounds:
            kwargs['extent'] = plotting_extent(source)

        if source.count == 1:
            arr = source.read(1, masked=True)
        else:
            try:

                # Lookup table for the color space in the source file. This will allow us to re-order it
                # to RGB if needed
                source_colorinterp = OrderedDict(zip(source.colorinterp, source.indexes))

                colorinterp = rasterio.enums.ColorInterp

                # Gather the indexes of the RGB channels in that order
                rgb_indexes = [source_colorinterp[ci] for ci in
                               (colorinterp.red, colorinterp.green, colorinterp.blue)]

                # Read the image in the proper order so the numpy array will have the colors in the
                # order expected by matplotlib (RGB)
                arr = source.read(rgb_indexes, masked=True)
                arr = reshape_as_image(arr)

            except KeyError:
                arr = source.read(1, masked=True)
    else:
        # The source is a numpy array reshape it to image if it has 3+ bands
        source = np.ma.squeeze(source)
        if len(source.shape) >= 3:
            arr = reshape_as_image(source)
        else:
            arr = source
        if transform and with_bounds:
            kwargs['extent'] = plotting_extent(arr, transform)
    if adjust and arr.ndim >= 3:
        # Adjust each band by the min/max so it will plot as RGB.
        arr = reshape_as_raster(arr)
        for ii, band in enumerate(arr):
            arr[ii] = adjust_band(band, kind='linear')
        arr = reshape_as_image(arr)

    show = False
    if not ax:
        show = True
        ax = plt.gca()

    if contour:
        if 'cmap' not in kwargs:
            kwargs['colors'] = kwargs.get('colors', 'red')
        kwargs['linewidths'] = kwargs.get('linewidths', 1.5)
        kwargs['alpha'] = kwargs.get('alpha', 0.8)

        C = ax.contour(arr, origin='upper', **kwargs)
        if contour_label_kws is None:
            # no explicit label kws passed use defaults
            contour_label_kws = dict(fontsize=8,
                                     inline=True)
        if contour_label_kws:
            ax.clabel(C, **contour_label_kws)
    else:
        ax.imshow(arr, **kwargs)
    if title:
        ax.set_title(title, fontweight='bold')

    if show:
        plt.show()

    return ax
细看这段代码,可以深挖一些细节,比如使用了线性拉伸,如下:
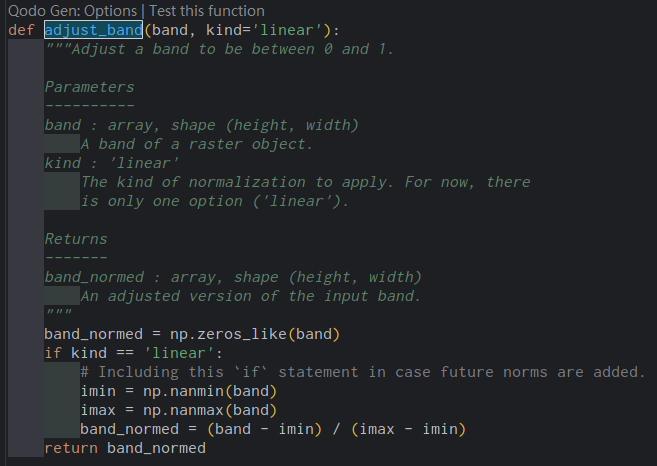
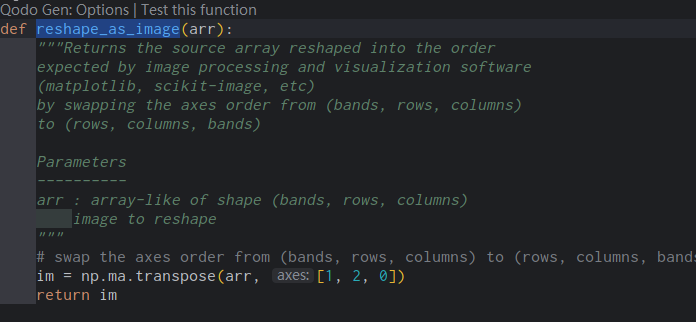
比如使用了数组调整:
这些代码片段,我们完全是可以复用的,这也是学习rasterio源代码的原因。
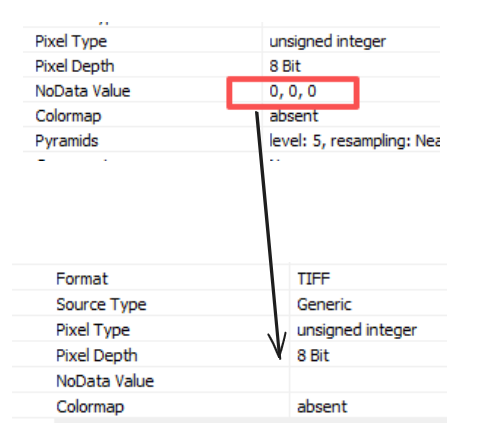
我们要搞清楚,为什么它要使用线性拉伸?原因我们之前也说过,是因为屏幕显示的图片只能是0-1或者是0-255的图像。线性拉伸是为了把图像的数值范围缩放到指定的范围。
为什么它要使用数组调整?因为rasterio是基于gdal开发的,show函数使用matplotlib可视化。而matplotlib对于图像的格式,与gdal读取到的图像格式不一样,所以要进行数组调整。
那你说你是小白,你看不懂这些源代码怎么办?
你可以把这源代码喂给AI,让AI带着你学啊!学习效率大大提高,我们要善于利用AI,让它帮我们做事情。
如果你是使用网页端的AI,我推荐grok。这个是众多免费ai中,给我的体验最佳。如果你网络不通畅,我推荐豆包、通义千问。
如果你是使用付费ai,我推荐trae,听说cursor体验更好但更贵,我现在只用过trae。
当然,现在的ai编程发展极快,这里的推荐仅限于2025年7月。
GDAL vs Rasterio
| 特性 | GDAL (osgeo.gdal) |
Rasterio |
|---|---|---|
| 学习曲线 | 陡峭平缓 | 对 Python 用户友好 |
| API 风格 | C++ 风格 | Pythonic |
| 核心优势 | 功能全面 | 易用性 |
| 代码量 | 较多 | 精简 |
| 核心依赖 | 无 | 依赖于GDAL和NumPy |
| 生态关系 | 底层基础库 | GDAL 的高级封装 |
应该学哪个?
答案非常明确:
对于绝大多数 Python 开发者、地理空间编程的初学者来说,请毫不犹豫地从 Rasterio 开始。
为什么?
- 更低的入门门槛:Rasterio 可以在几分钟内就开始读写和处理栅格数据,快速获得成就感,这对于学习至关重要。
- 更高的开发效率:简洁的 API 和与 NumPy 的完美结合将极大提升开发效率,让你能将更多时间花在数据分析和算法实现上。
- 覆盖绝大多数场景:对于日常的数据转换、分析、可视化等任务,Rasterio 已经能满足你 95% 以上的需求。
那么,什么时候需要学习 GDAL 呢?
当你使用 Rasterio 遇到瓶颈时,就是学习 GDAL 的最佳时机。这些场景可能包括:
- 你需要使用一个 Rasterio 没有封装的、非常特殊的 GDAL 功能。
- 你正在编写复杂的命令行批处理脚本。
- 你对性能有极致的要求,需要绕过 Rasterio 的封装直接调用底层 C++ 接口进行优化。
- 你需要在非 Python 环境(如 C++ 或 Java)中工作。
对于我本人而言,目前,我在大多数情况下,能使用GDAL,我就使用GDAL。因为GDAL可以处理栅格、矢量。这也方便我使用其他的语言去调用GDAL。
结论
因此,你的学习路径应该是:从 Rasterio 开始,享受 Pythonic 的地理空间编程体验。当你的需求超越了 Rasterio 的范畴时,再去深入探索其背后的库——GDAL。
这样的路径不仅更平滑,也更符合现代 Python 数据科学的开发范式。
当然,学或不学、学但怎么学,都取决于你的需求,怎么舒服你就怎么来就行了。