yolov8目标检测的标签格式
yolov8目标检测的标签格式
ytkz深度学习图像处理一般分为三个步骤:标签制作、模型训练、推理预测。
现在我准备做是目标检测,使用的框架是yolov8。
使用yolov8并不是代表落后,而是yolov8足够实用,你们当然可以使用最新的yolov26,在这一点上是无所谓的。
由于目标检测的篇幅很长,我打算分块写。所以今天的主题是标签制作。
别急哈,我们一步步来。
那么我们得先知道什么是yolov8标签格式。这时候问下大模型,快速过一哈。
以下是 YOLOv8 标签格式的详细说明:
1. 标签文件格式
文件扩展名:.txt
命名规则:标签文件的名称需要与对应的图像文件名一致(扩展名除外)。例如,图像文件为 image1.jpg,则标签文件为 image1.txt。
文件内容:每行表示图像中的一个目标对象,格式如下:
text
<class_id> <x_center> <y_center> <width> <height>:目标类别的索引(从 0 开始的整数,基于数据集中的类别顺序)。 :边界框中心点的 x 坐标(归一化,范围 [0, 1],相对于图像宽度)。 :边界框中心点的 y 坐标(归一化,范围 [0, 1],相对于图像高度)。 :边界框的宽度(归一化,范围 [0, 1],相对于图像宽度)。 :边界框的高度(归一化,范围 [0, 1],相对于图像高度)。
2. 归一化坐标
YOLOv8 使用归一化坐标,即将边界框的坐标和尺寸除以图像的宽度和高度,转换为 [0, 1] 范围内的值。公式如下:
- x_center = (x_min + x_max) / (2 * image_width)
- y_center = (y_min + y_max) / (2 * image_height)
- width = (x_max - x_min) / image_width
- height = (y_max - y_min) / image_height
其中,x_min, x_max, y_min, y_max 是边界框的像素坐标,image_width 和 image_height 是图像的宽度和高度。
3. 示例
假设有一张 640x480 的图像,包含两个对象,类别分别为 0(猫)和 1(狗),边界框信息如下:
- 猫:边界框 (x_min=100, y_min=50, x_max=300, y_max=250)
- 狗:边界框 (x_min=400, y_min=200, x_max=600, y_max=400)
计算归一化坐标:
- 猫:
- x_center = (100 + 300) / (2 * 640) = 0.3125
- y_center = (50 + 250) / (2 * 480) = 0.3125
- width = (300 - 100) / 640 = 0.3125
- height = (250 - 50) / 480 = 0.4167
- 狗:
- x_center = (400 + 600) / (2 * 640) = 0.78125
- y_center = (200 + 400) / (2 * 480) = 0.625
- width = (600 - 400) / 640 = 0.3125
- height = (400 - 200) / 480 = 0.4167
对应的标签文件 image1.txt 内容为:
0 0.3125 0.3125 0.3125 0.4167
1 0.78125 0.625 0.3125 0.4167
宝子等一下,以上的内容是普通图片的yolov8标签的格式。那么遥感图像的yolov8的标签怎么制作呢?
我采取的措施是:1.在acrgis绘制所需目标的面矢量;2.编写代码,批量制作标签。
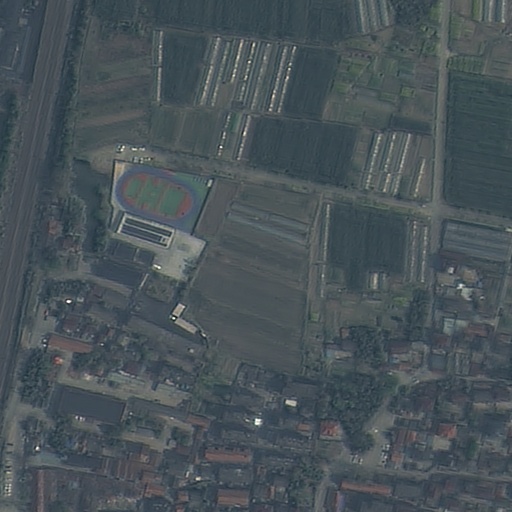
假设现在我已经画好了矢量,我把影像放大后,局部的细节如下:
这时,我们完成了第一步:矢量绘制。
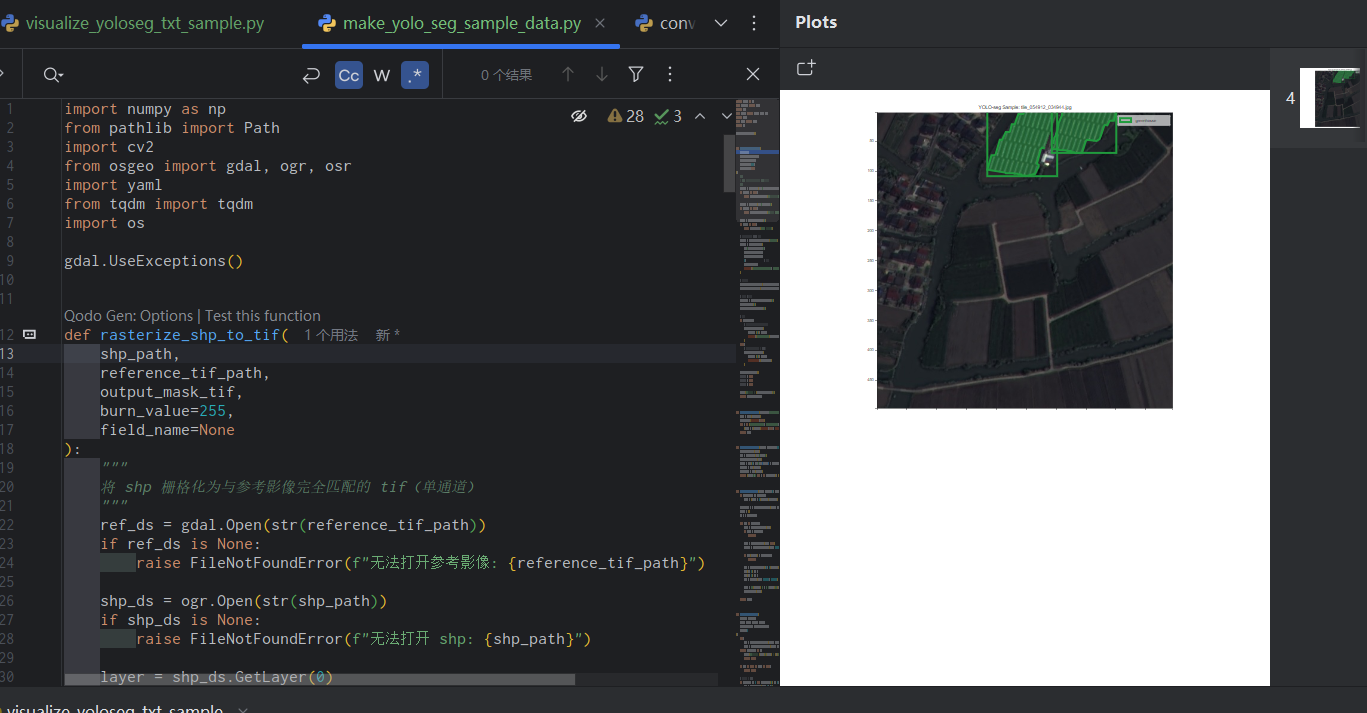
第二步就需要写代码:一边滑窗切割影像,一边读取相应范围内的矢量,最终得到yolov8的标签。
样本制作的代码如下:
import geopandas as gpd
from osgeo import gdal, osr
from shapely.geometry import Polygon, box
import os

def tile_large_image_and_generate_labels(image_path, shp_path, output_dir, tile_size=(512, 512), class_map={'vehicle': 0}):
    os.makedirs(os.path.join(output_dir, 'images'), exist_ok=True)
    os.makedirs(os.path.join(output_dir, 'labels'), exist_ok=True)

    ds = gdal.Open(image_path)
    if ds is None:
        raise ValueError(f"无法打开图像: {image_path}")

    image_width = ds.RasterXSize
    image_height = ds.RasterYSize
    transform = ds.GetGeoTransform()
    proj = ds.GetProjection()
    crs = osr.SpatialReference(proj) if proj else None

    gdf = gpd.read_file(shp_path)

    if gdf.crs != crs.ExportToWkt():
        gdf = gdf.to_crs(crs.ExportToWkt())

    tile_width, tile_height = tile_size
    num_tiles_x = (image_width + tile_width - 1) // tile_width
    num_tiles_y = (image_height + tile_height - 1) // tile_height

    print(f"总块数: {num_tiles_x * num_tiles_y} ({num_tiles_x} x {num_tiles_y})")

    for i in range(num_tiles_y):
        for j in range(num_tiles_x):
            offset_x = j * tile_width
            offset_y = i * tile_height
            current_width = min(tile_width, image_width - offset_x)
            current_height = min(tile_height, image_height - offset_y)

            minx = transform[0] + offset_x * transform[1] + offset_y * transform[2]
            maxy = transform[3] + offset_x * transform[4] + offset_y * transform[5]
            maxx = minx + current_width * transform[1] + current_height * transform[2]
            miny = maxy + current_width * transform[4] + current_height * transform[5]

            tile_bounds = box(minx, miny, maxx, maxy)

            clipped_gdf = gdf[gdf.geometry.intersects(tile_bounds)]
            if clipped_gdf.empty:
                continue

            labels = []

            for idx, row in clipped_gdf.iterrows():
                geom = row.geometry.intersection(tile_bounds)

                if geom.is_empty or not isinstance(geom, (Polygon)):
                    continue

                class_name = row.get('class', 'vehicle')
                if class_name not in class_map:
                    print(f"未知类别: {class_name}, 跳过")
                    continue
                class_id = class_map[class_name]

                bbox_minx, bbox_miny, bbox_maxx, bbox_maxy = geom.bounds

                pixel_width = transform[1]
                pixel_height = abs(transform[5])

                x_min_pix = (bbox_minx - minx) / pixel_width
                y_min_pix = (maxy - bbox_maxy) / pixel_height
                x_max_pix = (bbox_maxx - minx) / pixel_width
                y_max_pix = (maxy - bbox_miny) / pixel_height

                bbox_width_pix = x_max_pix - x_min_pix
                bbox_height_pix = y_max_pix - y_min_pix
                x_center_pix = x_min_pix + bbox_width_pix / 2
                y_center_pix = y_min_pix + bbox_height_pix / 2

                x_center = x_center_pix / current_width
                y_center = y_center_pix / current_height
                width = bbox_width_pix / current_width
                height = bbox_height_pix / current_height

                if 0 < width <= 1 and 0 < height <= 1 and 0 <= x_center <= 1 and 0 <= y_center <= 1:
                    labels.append(f"{class_id} {x_center:.6f} {y_center:.6f} {width:.6f} {height:.6f}")
                else:
                    print(f"无效边界框 (超出块): {idx}")

            if not labels:
                continue

            tile_name = f"tile_{i}_{j}"
            tile_image_path = os.path.join(output_dir, 'images', f"{tile_name}.tif")

            gdal.Translate(
                tile_image_path,
                ds,
                srcWin=[offset_x, offset_y, current_width, current_height],
                format='GTiff',
                projWin=None
            )

            tile_label_path = os.path.join(output_dir, 'labels', f"{tile_name}.txt")
            with open(tile_label_path, 'w') as f:
                f.write('\n'.join(labels) + '\n')

            print(f"生成块: {tile_name} (图像: {tile_image_path}, 标签: {tile_label_path}, 目标数: {len(labels)})")

    ds = None

    data_yaml_path = os.path.join(output_dir, 'data.yaml')
    with open(data_yaml_path, 'w') as f:
        f.write(f"""train: {os.path.join(output_dir, 'images')}
val: {os.path.join(output_dir, 'images')}
nc: 1
names: ['vehicle']
""")
    print(f"数据集配置文件生成: {data_yaml_path}")

if __name__ == "__main__":
    image_path = 'X:\\影像\\imagery_20250925_zoom19.tif'
    output_dir = r'X:\\output_tiles'

    tile_large_image_and_generate_labels(image_path, shp_path, output_dir)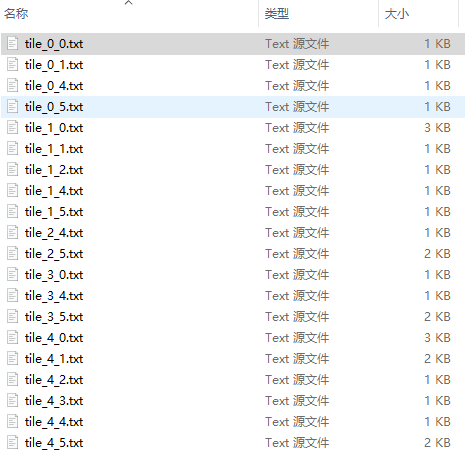
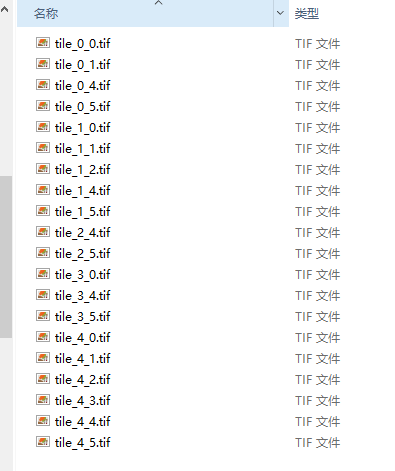
我们打开tile_0_0.txt,如下:
0 0.051170 0.685652 0.035934 0.022555
0 0.314973 0.939455 0.017767 0.038241
0 0.156948 0.594211 0.039995 0.014907
0 0.058777 0.592575 0.037087 0.013089
0 0.215305 0.734250 0.030906 0.014798
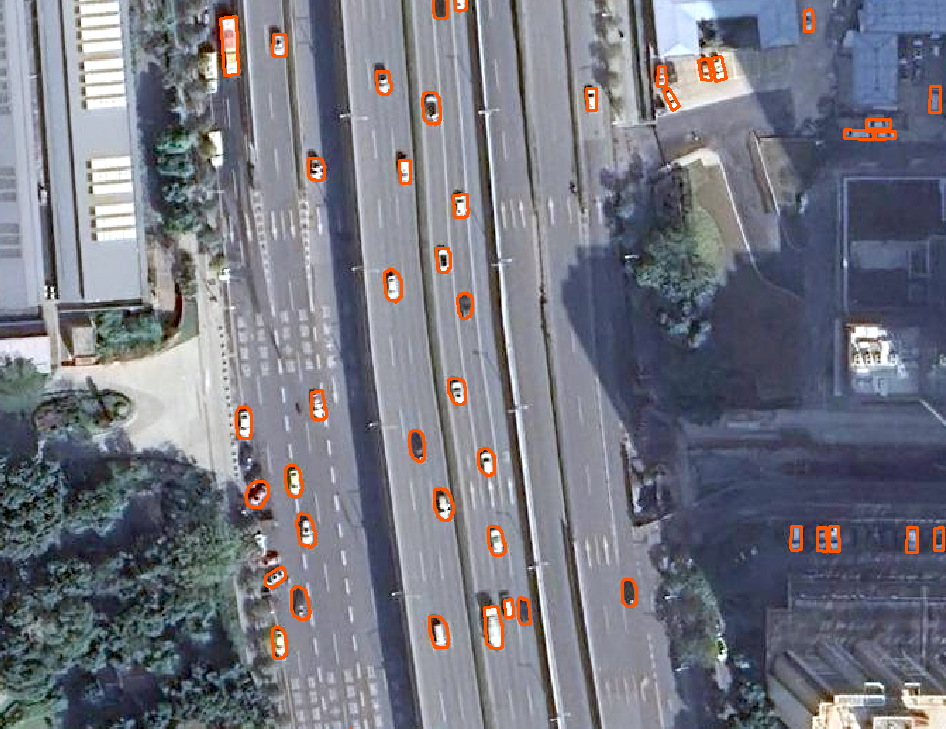
tile_0_0.txt对应的图像样本如下:
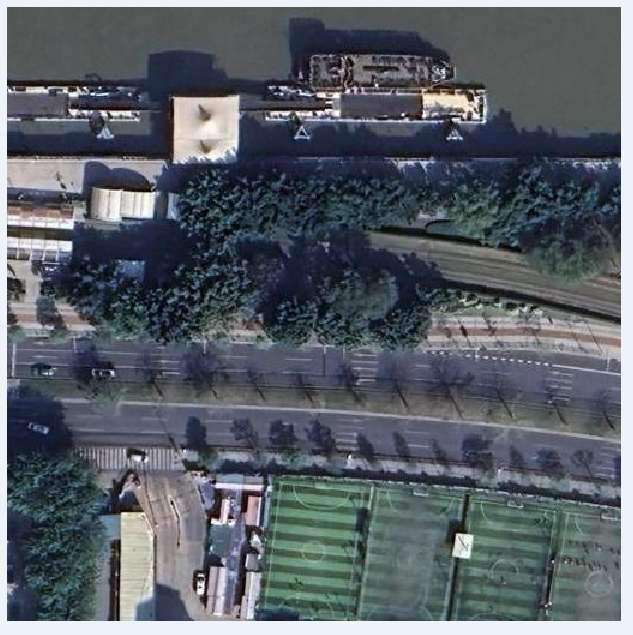
我们的检测框是用水平框来表示的,另一种是用旋转框来表示。从描述目标在图像中位置的功能上看,这两种方式本质上差不多。
虽然在遥感图像中,车辆可能以各种角度出现,但我们还是选了更简单的水平框作为标签,因为这样标注起来更省事,模型设计和计算也更简单。
简单来说,模型的训练和预测都以标签为准,标签的质量决定了模型的效果好坏。
我们用了水平框,模型最后输出的也是水平框。预测结果一般是一个 .txt 或 .json 文件,里面会告诉你:检测到多少个目标、每个目标在图像中的位置(用框的坐标表示,比如左上角和右下角的点),还有这个预测有多可靠(用一个置信度分数表示)。
至此,我们的标签制作已完毕。
在这一过程中,绘制矢量花费的时间是最多。
等我整理模型训练、推理预测的内容完毕,我会写一个整合版本。到时候把涉及的遥感数据、矢量、标签文件都公开出来,方便大家学习。
今天开始日更,后面不会天天都写技术文章,简单写一写有的没的,感谢大家的支持,明天见。